Event Study in Google Sheets / Excel
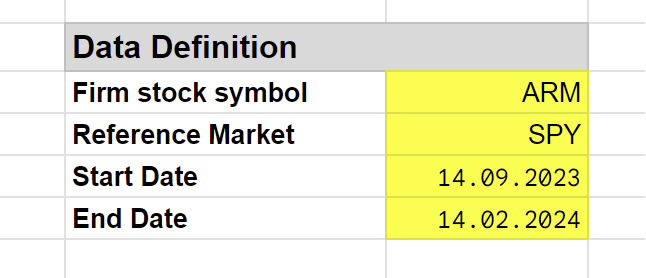
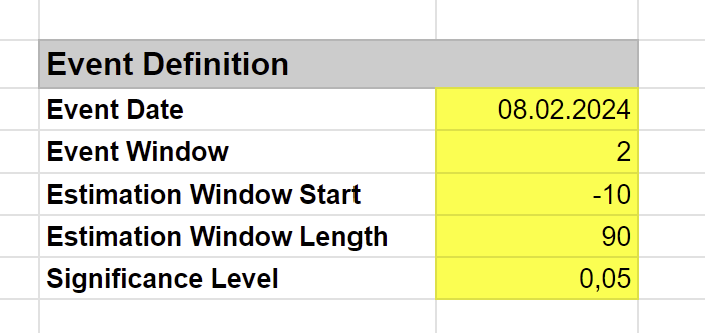
We offer an accessible Google Sheets template designed to demonstrate the practical implementation of Event Studies directly within your browser using the GoogleFinance API. Still, your data could also be copied into the sheet. Accessing the provided Google Sheets link will guide you through a detailed, step-by-step example showcasing the execution of event studies using this platform. All you need to do is enter the firm and reference the market stock symbol and the beginning and end date of the daily data extraction. The GoogleFinance API will automatically fetch the relevant (daily and adjusted) data directly into your Google Sheet. Afterwards, you define the Event Date, the Event Window, and the Estimation Window. All other stuff is performed automatically in the sheet for you.
You need to download or copy the Google Sheet to your local device or your Google Account before you apply your own Event Study.
The following expected return models are included in the free template:
Here’s a succinct summary of the key steps involved:
Enter the Firm and Reference Market
For fetching the financial data, we use the GoogleFinance API in this sheet, but you may also use your own data. If you use your own data, it must be copied into the columns marked as Data/Close such that the automatic calculations are working.

Enter Event Date, the Event Window Length, the Estimation Window Parameters, and the Significance Level
In the next step, you need to define your Event Study parameters according to your research needs. That’s all. All further steps are done automatically.
Results
The results are presented to the right of the parameters. In the sheet a market model is applied. Therefore, alpha and beta from the model estimation is provided. As statistic the AR and CAR statistic is calculated plus the corresponding t statistic. Additionally, the corresponding critical value for your defined significance level is reported. AR values are reported in column S.

To seamlessly integrate these steps into your analysis, we highly encourage downloading the Google Sheets template provided. This resource not only simplifies the process but also enriches your understanding of event studies through hands-on experience.
