Free Template
Event Study in Google Sheets
Calculate abnormal returns directly in your browser using Google Sheets and the GoogleFinance API. Perfect for quick analyses, teaching, and single-event studies.
500+ downloads | Free forever | No signup required
How It Works
Our Google Sheets template automates the event study process. Just enter your parameters and let the template do the calculations.
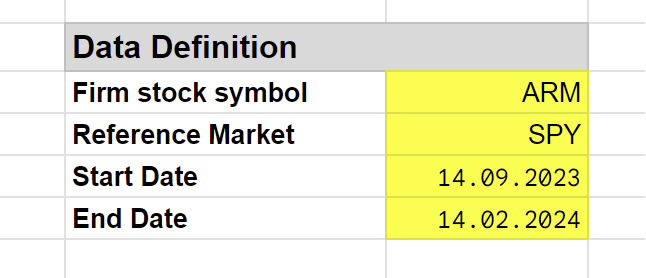
Step 1: Enter Stock Symbols
For fetching financial data, we use the GoogleFinance API. Enter the stock symbol for your firm and the reference market index.
You can also use your own data by copying it into the designated columns.
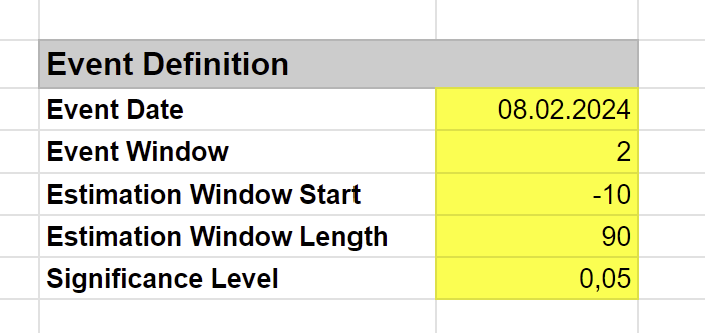
Step 2: Define Event Parameters
Configure your event study by entering:
- Event Date: The date of the event you’re studying
- Event Window: Days around the event to analyze (e.g., -5 to +5)
- Estimation Window: Historical period for estimating normal returns
- Significance Level: For statistical testing (e.g., 0.05)
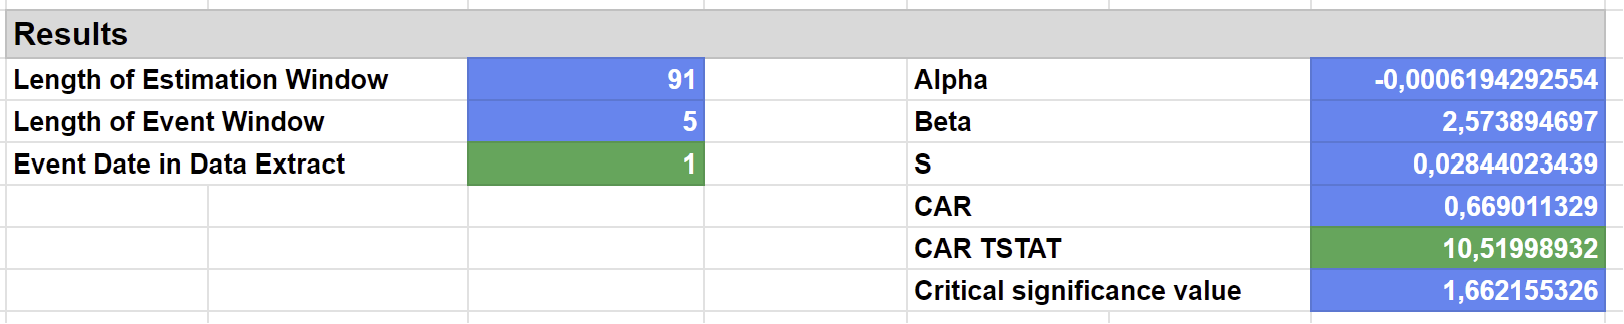
Step 3: Get Results
The template automatically calculates:
- Alpha and Beta from the market model estimation
- AR (Abnormal Return) for each day in the event window
- CAR (Cumulative Abnormal Return) across the window
- T-statistics for significance testing
- Critical values for your chosen significance level
Included Models
The template supports three expected return models:
Market Model
The most widely used approach. Estimates normal returns based on the relationship between the stock and market index.
\[R_{it} = \alpha_i + \beta_i R_{mt} + \varepsilon_{it}\]
Mean Adjusted Model
Uses the average return during the estimation period as the expected return.
\[AR_{it} = R_{it} - \bar{R}_i\]
Market Adjusted Model
Assumes beta equals 1 and alpha equals 0. Abnormal return is simply the difference from market return.
\[AR_{it} = R_{it} - R_{mt}\]
Features
Automatic Data Fetching
GoogleFinance API fetches adjusted daily prices automatically. No manual data entry required.
Multiple Models
Choose from Market Model, Mean Adjusted, or Market Adjusted expected returns.
Statistical Testing
Get t-statistics and compare against critical values for your significance level.
Works with Excel
Download and use in Excel. Just enter data manually instead of using GoogleFinance.
Export Ready
Copy results directly into your research paper or thesis.
Constantly Updated
Template is regularly updated with improvements and bug fixes.
Get Started
After downloading:
- Open the Google Sheet link provided
- Go to File > Make a copy to create your own editable version
- Follow the instructions in the template to run your event study
Need More Advanced Features?
For multi-event studies, cross-sectional regression, and advanced statistical tests, check out our R package.
Event Study R Package
Full-featured R package for comprehensive event studies with publication-quality outputs.
- Multiple events support
- Cross-sectional regression
- Non-parametric tests
- Visualizations
References
Recommended readings for event study methodology:
- The Econometrics of Financial Markets - Campbell, Lo, MacKinlay
- Event Studies for Financial Research - Sorescu, Warren, Erber
- Econometrics - Hayashi